Česky

JOSEF DOLEJŠ

Email: djosef@post.cz

List of publications

Introduction

Decrease of total radioactivity along with time

Decrease of postnatal mortality along with age

Individual development versus population heterogeneity

Model of congenital individual risks

Other examples

Mortality spectrum in 5 countries and all graphs

Mortality levels in 5 countries and all charts

Estimation of congenital defects

Points of time axis

Mortality rate in hours after birth

General trends of postnatal mortality in Europe


TOPlist
DECLINE OF POSTNATAL MORTALITY ALONG WITH AGE


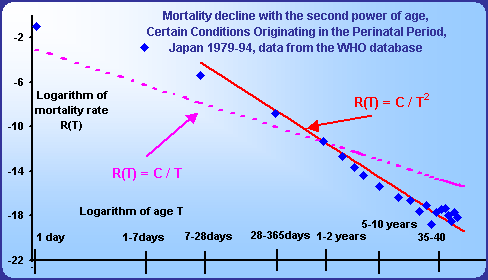
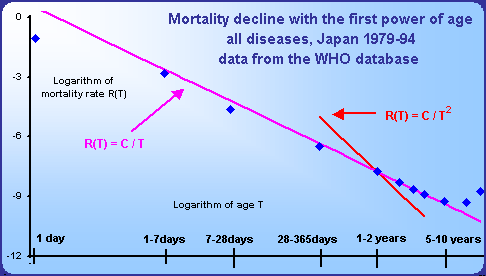
  Postnatal mortality declines with the first or with the second power of age. This decline continues minimally till the age of 10. Mortality rate declines for all particular diseases except malignant neoplasms minimally from the first year of life. The regression straight lines within the log-log scale are practically identical with the straight lines with the slope -1 or -2 drawn through the point of the age category 1-2 years.
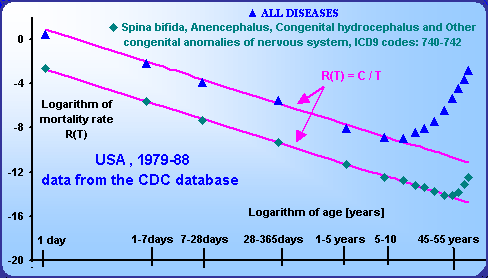
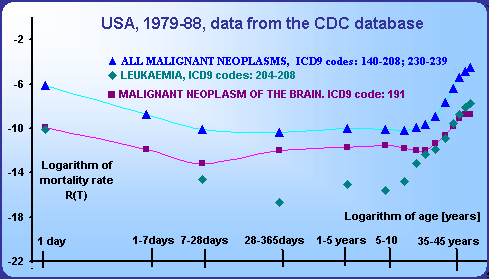
   Model of congenital individual risks explains the mortality decline as the result of population heterogeneity. Data comes from WHO and  CDC.   All results can be easy recalculated. According to the model of congenital individual risks, minimally 90% of deaths could be from the fragile subpopulation within the age interval 0-10 years. Congenital defects were also identified as a cause of death in the case of infectious diseases occurring before the age of 10. The mortality rate from malignant neoplasms is not age-dependent within the age interval 1-25 years. According to the model of congenital individual risks , there are no individuals with high individual risk whose dying off would cause mortality decline, as is the case of congenital defects and all other diseases after the first month of life.
  (The same chart is in the semi-logarithmic scale here).